
LB Finance PLC’s financial performance for the year ended 31st March 2024, as per the provided context, can be summarized as follows:
Profitability:
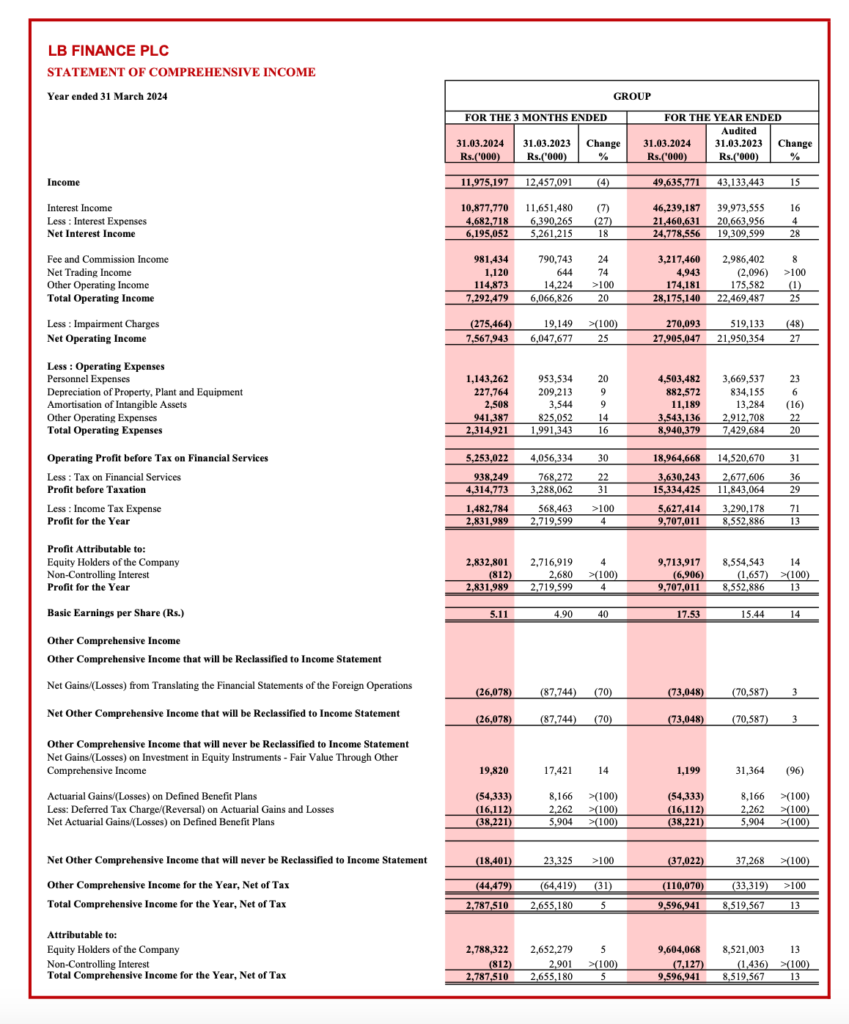
- Net Profit for 31st March 2023: Rs. 8,554,543,000
- Net Profit for 31st March 2024: Rs. 9,713,917,000
Percentage Change in Net Profit = [(9,713,917,000 – 8,554,543,000) / 8,554,543,000] x 100
Percentage Change in Net Profit ≈ 13.56%
This indicates that LB Finance PLC’s profitability has increased by approximately 13.56% from the previous year. This is a positive sign for the company’s financial performance.
Income Statement Highlights:
- Total income for the year ended 31st March 2024 was Rs. 49,230,095,000, which is a 15% increase from the previous year’s total income of Rs. 42,756,458,000.
- Interest income, which is a significant component of the total income, was Rs. 45,866,539,000 for the year ended 31st March 2024, marking a 16% increase from Rs. 39,643,934,000 in the previous year.
- Interest expenses decreased by 27% to Rs. 21,379,246,000 for the year ended 31st March 2024, down from Rs. 29,524,629,000 in the previous year.
- The profit and other comprehensive income before taxation for the year ended 31st March 2024 was Rs. 15,127,700,000, compared to Rs. 11,785,455,000 for the previous year, indicating a significant improvement in profitability.
Balance Sheet Highlights:
- The company’s cash and cash equivalents stood at Rs. 9,314,425,000 as of 31st March 2024, more than double the Rs. 4,524,032,000 reported as of 31st March 2023.
- Financial assets at amortised cost – loans and receivables were Rs. 161,291,486,000 as of 31st March 2024, compared to Rs. 145,189,174,000 as of 31st March 2023, showing growth in this asset category.
Equity and Liabilities:
- The total equity of the company increased to Rs. 43,911,255,000 as of 31st March 2024, up from Rs. 38,324,101,000 as of 31st March 2023.
- The debt equity ratio was 60.54% as of 31st March 2024, which is a decrease from 67.79% as of 31st March 2023, indicating a stronger equity position relative to debt.
Share Information:
- The share price of LB Finance PLC saw a highest trading price of Rs. 65.40 and a lowest of Rs. 58.00 during the year ended 31st March 2024. The last traded price was Rs. 62.80.
- There was no change in the number of ordinary shares issued, which remained at 554,057,136 for both years.
- Share Price as at 15th May 2024 was Rs 70.30
Segment Information:
- The company operates in four segments: Leasing, Loans and Advances, Others, and International Operation. Detailed segment performance was not provided in the context.
Commitments and Contingencies:
- Commitments and contingencies as at 31st March 2024 were Rs. 2,282 Mn, a slight decrease from Rs. 2,404 Mn as at 31st March 2023.
This analysis indicates that LB Finance PLC has experienced growth in income and profitability, a reduction in interest expenses, and an improvement in its equity position. The company’s financial assets have also grown, and it has managed to reduce its debt equity ratio, which could be seen as a positive sign of financial health.
Key Ratios
Based on the provided context from LB Finance PLC’s interim financial statements for the year ended 31st March 2024, the following key financial ratios can be calculated and analyzed:
1. Debt Equity Ratio:
- As of 31st March 2024: 60.54%
- As of 31st March 2023: 67.79%
This ratio indicates the proportion of equity and debt the company is using to finance its assets. The decrease in the ratio suggests that the company has either increased its equity or reduced its debt, leading to a relatively lower financial risk.
2. Quick Asset Ratio:
- As of 31st March 2024: 23.13%
- As of 31st March 2023: 22.74%
The quick asset ratio, also known as the acid-test ratio, measures the ability of a company to meet its short-term obligations with its most liquid assets. The slight increase indicates a marginal improvement in the company’s liquidity position.
3. Interest Cover:
- As of 31st March 2024: 1.71
- As of 31st March 2023: 1.57
The interest cover ratio measures the company’s ability to meet its interest payments on outstanding debt. An increase in this ratio suggests that the company is in a better position to cover its interest expenses from its earnings before interest and taxes (EBIT).
4. Capital Adequacy Ratios:
- Core Capital to Risk Weighted Asset Ratio (Minimum 10%):
- As of 31st March 2024: 24.48%
- As of 31st March 2023: 30.50%
- Total Capital to Risk Weighted Asset Ratio (Minimum 14%):
- As of 31st March 2024: 25.23%
- As of 31st March 2023: 31.13%
These ratios are critical for financial institutions, indicating the capital buffer available to absorb potential losses. While the ratios remain well above the regulatory minimums, there has been a decrease from the previous year.
5. Profitability Ratios:
- Return on Average Shareholders’ Funds (After Tax):
- As of 31st March 2024: 23.40%
- As of 31st March 2023: 23.78%
- Return on Average Assets (After Tax):
- As of 31st March 2024: 4.97%
- As of 31st March 2023: 4.88%
These ratios measure the profitability of the company relative to its equity and assets. The return on average assets has improved, indicating better asset utilization, while the return on average shareholders’ funds has slightly decreased.
6. Asset Quality Ratios:
- Gross Non-Performing Accommodations Ratio:
- As of 31st March 2024: 3.54%
- As of 31st March 2023: 4.45%
- Net Non-Performing Accommodations Ratio:
- As of 31st March 2024: -0.79%
- As of 31st March 2023: -0.65%
These ratios assess the quality of the loan portfolio. The decrease in the gross non-performing accommodations ratio is a positive sign, indicating a reduction in the proportion of non-performing loans to total loans.
These key ratios provide insights into LB Finance PLC’s financial health and performance over the fiscal year ended 31st March 2024. It is important to consider these ratios in the context of the company’s historical performance, industry benchmarks, and overall economic conditions when making investment decisions or conducting a financial analysis.