
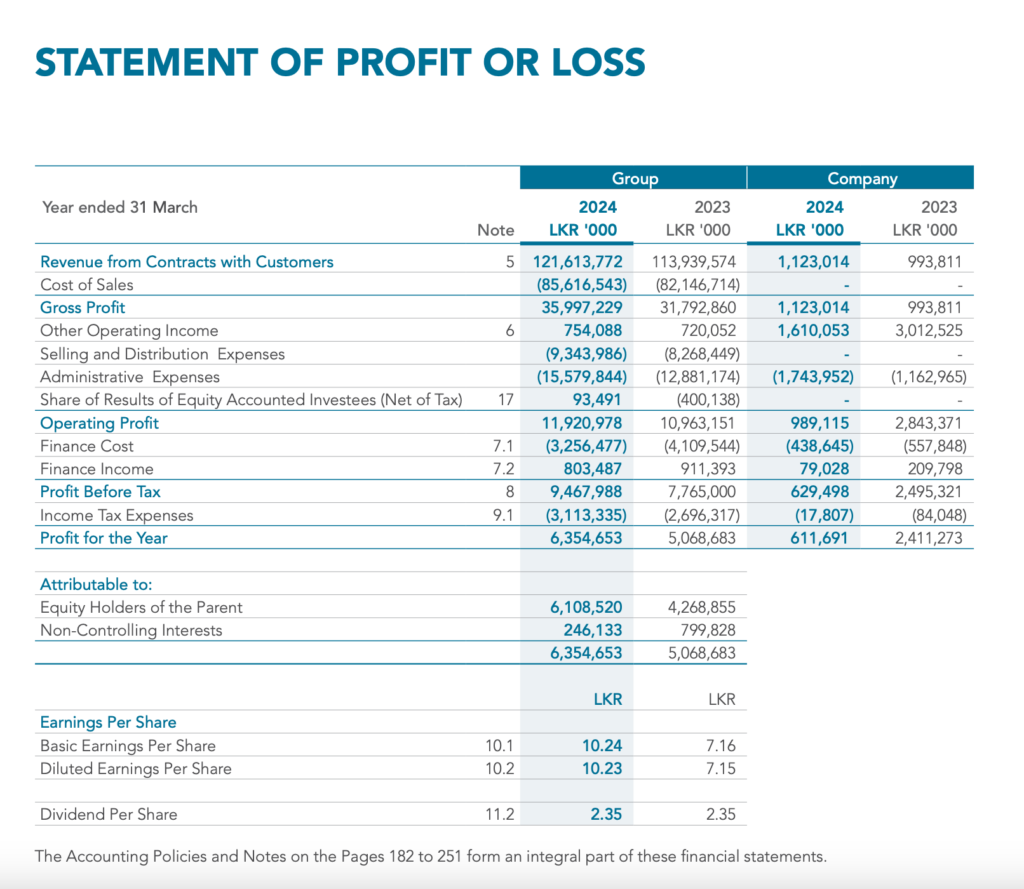
Hemas Holdings PLC demonstrated robust financial performance for the year ended 31st March 2024. The company reported a consolidated revenue of Rs. 121.6 billion, which is a 6.7% increase from the previous year’s revenue of Rs. 113.9 billion. This growth was driven by strategic initiatives and market expansion efforts, particularly in the Consumer Brands and Healthcare sectors, which operated under relatively stable conditions.
The company’s profitability saw a significant improvement, with earnings growing by 43.1% to reach Rs. 6.1 billion, up from Rs. 4.3 billion in the previous year. This substantial increase in earnings can be attributed to the strong performance of core businesses and a notable reduction in finance costs, which decreased by 20.8% from Rs. 4.1 billion in the previous year to Rs. 3.3 billion.
Gross profit for the year was Rs. 36.0 billion, a 13.2% increase from Rs. 31.8 billion in the previous fiscal year. The company also reported the highest ever earnings in its history at Rs. 6.1 billion, indicating a strong operational efficiency and financial management.
The Earnings Before Interest and Taxes (EBIT) also grew by 8.7% to Rs. 11.9 billion, up from Rs. 11.0 billion in the previous year. The net finance cost was reduced to Rs. 2.5 billion, a 23.3% decrease, contributing to the overall profitability.
The financial statements of Hemas Holdings PLC, including the Statement of Profit or Loss and Statement of Comprehensive Income, provide detailed information on the financial performance of the Group and the Company for the year under review. These statements have been consolidated to include all subsidiaries and equity-accounted investees.
The company’s financial performance indicates a positive trajectory, with a three-year revenue Compound Annual Growth Rate (CAGR) of 23.5%. Despite facing challenges such as consumer purchasing power constraints and regulatory price reductions in the healthcare industry, Hemas Holdings PLC has managed to navigate these complexities effectively and deliver a strong financial performance for the year ended 31st March 2024.
Key Ratios and Net Asset Position
For the year ended 31st March 2024, Hemas Holdings PLC reported several key financial ratios that reflect the company’s financial stability and performance:
- Current Ratio: The current ratio for FY24 is 1.6 times, which is an improvement from the previous year’s ratio of 1.4 times. This indicates that the company has a better short-term liquidity position and is more capable of covering its current liabilities with its current assets.
- Debt/Equity Ratio: The debt/equity ratio has seen a significant decrease to 28.8% in FY24 from 54.8% in FY23. This suggests that the company has reduced its reliance on debt to finance its assets, which is a positive sign for financial stability.
- Net Gearing Ratio: The net gearing ratio has turned negative to -1.2% in FY24, compared to 11.6% in FY23. This indicates that the company has more cash and equivalents than debt, which is a strong indicator of financial health.
- Quick Ratio: The quick ratio for FY24 is 1.0 times, up from 0.9 times in FY23. This ratio measures the company’s ability to meet its short-term obligations with its most liquid assets, and the improvement suggests a better liquidity position.
- Assets Turnover Ratio: The assets turnover ratio is 1.3 times in FY24, which is an increase from 1.2 times in FY23. This ratio indicates how efficiently the company is using its assets to generate sales.
- Interest Cover: The interest cover ratio has improved to 3.7 times in FY24 from 2.7 times in FY23, showing that the company is in a better position to cover its interest expenses from its operating income.
- Net Asset Per Share: The net asset value per share as of 31st March 2024 is LKR 72.79, which is an increase from LKR 64.38 in the previous year.
- Gearing Ratio: The gearing ratio, which indicates the proportion of a company’s borrowed funds to its equity, is 22.4% in FY24, down from 35.4% in FY23, showing a reduction in financial leverage.
- Return on Capital Employed (ROCE): The ROCE for FY24 is 22.1%, slightly down from 22.9% in FY23, but still indicates a strong return on the capital employed by the company.
In terms of the net asset position, Hemas Holdings PLC’s total assets stood at Rs. 93,723 million, while total equity was reported at Rs. 44,120 million for the year ended 31st March 2024. This represents a solid net asset position, with an increase in total equity from Rs. 39,120 million in the previous year, reflecting the company’s growth in net worth.