
Melstacorp PLC has provided their interim financial statements for the year ended 31st March 2024, detailing the company’s financial performance, profitability, and key financial ratios. This report analyzes the core components, comparing them with the previous year to understand the financial health and performance trends.
Revenue and Gross Profit
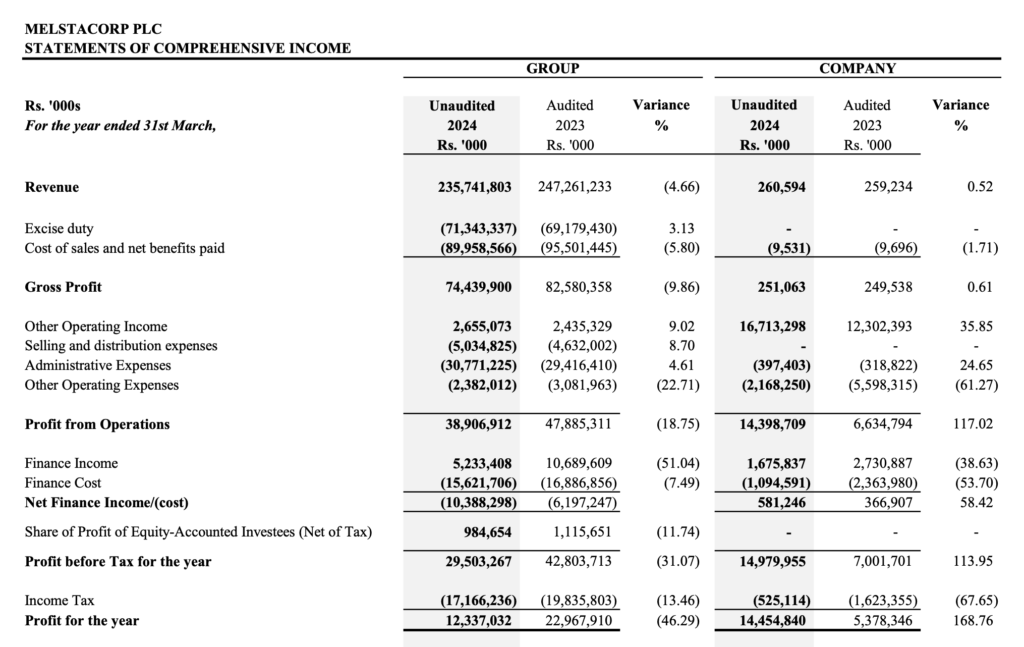
- Revenue: Melstacorp PLC reported a total revenue of Rs. 235,741.8 million for the year ended 31st March 2024, a decrease of 4.66% from Rs. 247,261.2 million in 2023. The excise duty on beverages was Rs. 71,343.3 million, up 3.13% from Rs. 69,179.4 million in the previous year, leading to a net revenue of Rs. 164,398.5 million, down from Rs. 178,081.8 million.
- Gross Profit: The gross profit for the year was Rs. 74,439.9 million, a decline of 9.86% from Rs. 82,580.4 million in 2023.
Expenses
- Cost of Sales: The cost of sales decreased by 5.80% to Rs. 89,958.6 million from Rs. 95,501.4 million in 2023.
- Selling and Distribution Expenses: These expenses increased by 8.70% to Rs. 5,034.8 million from Rs. 4,632.0 million.
- Administrative Expenses: Administrative expenses rose by 4.61% to Rs. 30,771.2 million from Rs. 29,416.4 million.
Other Income and Expenses
- Other Operating Income: Increased by 9.02% to Rs. 2,655.1 million from Rs. 2,435.3 million.
- Finance Income and Costs: Finance income decreased significantly by 51.04% to Rs. 5,233.4 million from Rs. 10,689.6 million, while finance costs decreased by 7.49% to Rs. 15,621.7 million from Rs. 16,886.9 million, resulting in a net finance cost of Rs. 10,388.3 million, compared to Rs. 6,197.2 million in the previous year.
Profitability
- Profit Before Taxation: The profit before taxation for the year was Rs. 29,503.3 million, a decrease of 31.07% from Rs. 42,803.7 million in 2023.
- Net Profit: The net profit for the year was Rs. 12,337.0 million, down 46.29% from Rs. 22,967.9 million in the previous year .
Key Financial Ratios
- Earnings Per Share (EPS): The basic earnings per share decreased to Rs. 7.97 from Rs. 14.78 in 2023 .
- Net Asset Value (NAV) Per Share: The NAV per share for the group was Rs. 98.02, an increase from Rs. 84.48 in 2023. For the company, NAV per share was Rs. 91.95, up from Rs. 78.70 in the previous year .
- Debt to Equity Ratio: Calculated as total liabilities divided by total equity. As of 31st March 2024, the debt to equity ratio was approximately 1.04, indicating the company’s leverage level.
Financial Position
- Total Assets: The total assets of Melstacorp PLC as of 31st March 2024 were Rs. 354,588.7 million, up from Rs. 334,481.6 million in 2023.
- Total Equity: Total equity increased to Rs. 174,111.3 million from Rs. 150,792.3 million, reflecting an improvement in shareholder value .
Conclusion
Melstacorp PLC experienced a mixed financial performance for the year ended 31st March 2024. While there were decreases in revenue and net profit, the company saw improvements in certain operational efficiencies and an increase in equity. The financial ratios indicate a stable but cautious outlook, highlighting areas for improvement in profitability and cost management.