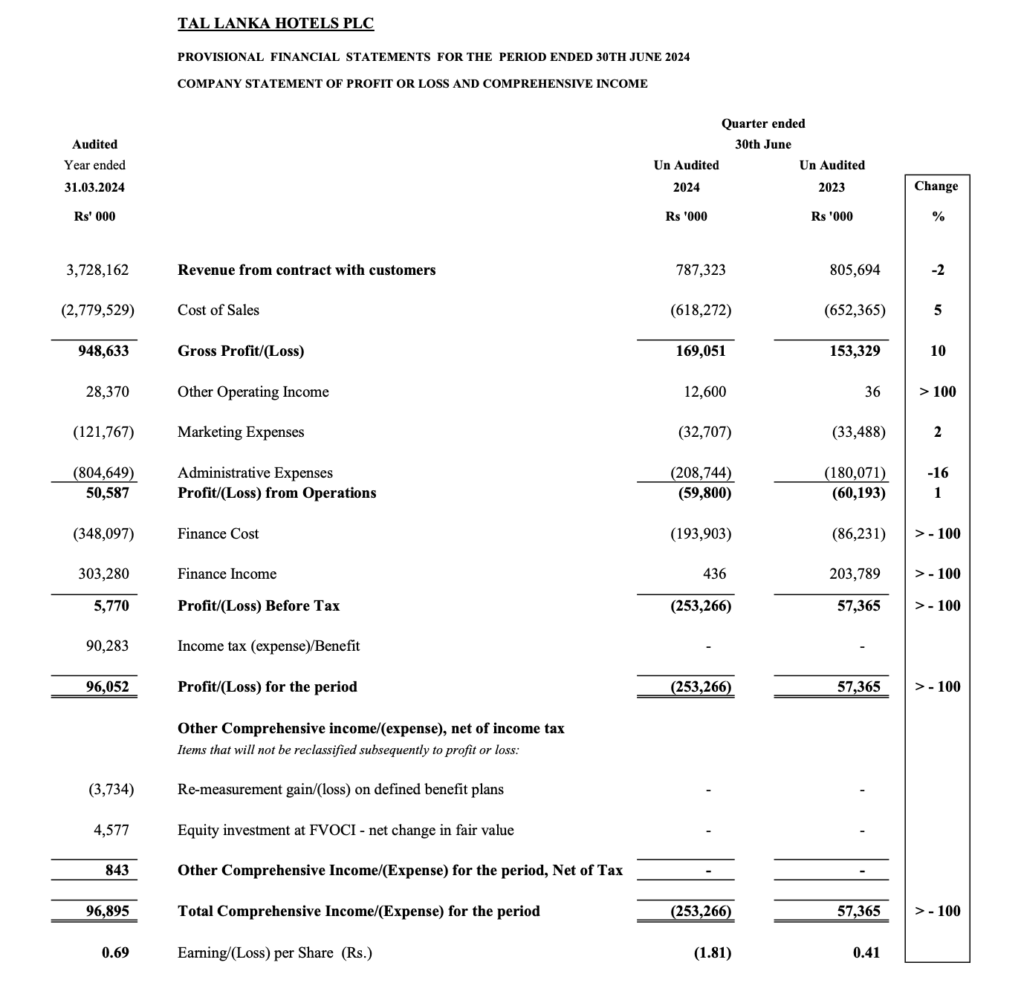
Financial Performance of TAL Lanka PLC for the Period Ended 30 June 2024
- Revenue from Contract with Customers: Rs. 787,323 (‘000), a decrease of 2% from Rs. 805,694 (‘000) in 2023.
- Cost of Sales: Rs. 618,272 (‘000), a decrease of 5% from Rs. 652,365 (‘000) in 2023.
- Gross Profit: Rs. 169,051 (‘000), an increase of 10% from Rs. 153,329 (‘000) in 2023.
- Other Operating Income: Rs. 12,600 (‘000), a significant increase compared to Rs. 36 (‘000) in 2023.
- Marketing Expenses: Rs. 32,707 (‘000), a decrease of 2% from Rs. 33,488 (‘000) in 2023.
- Administrative Expenses: Rs. 208,744 (‘000), an increase of 16% from Rs. 180,071 (‘000) in 2023.
- Profit/(Loss) from Operations: Rs. (59,800) (‘000), a slight improvement from Rs. (60,193) (‘000) in 2023.
- Finance Cost: Rs. 193,903 (‘000), a significant increase from Rs. 86,231 (‘000) in 2023.
- Finance Income: Rs. 436 (‘000), a significant decrease from Rs. 203,789 (‘000) in 2023.
- Profit/(Loss) Before Tax: Rs. (253,266) (‘000), a decrease from Rs. 57,365 (‘000) in 2023.
- Income Tax Expense/Benefit: No tax expense reported.
- Profit/(Loss) for the Period: Rs. (253,266) (‘000), a significant decrease from Rs. 57,365 (‘000) in 2023.
- Other Comprehensive Income: No other comprehensive income reported.
- Total Comprehensive Income for the Period: Rs. (253,266) (‘000), a significant decrease from Rs. 57,365 (‘000) in 2023.
- Earnings/(Loss) per Share: Rs. (1.81), a significant decrease from Rs. 0.41 in 2023.
Statement of Financial Position
- Total Assets: Rs. 4,943,361 (‘000) as at 30 June 2024, compared to Rs. 5,054,498 (‘000) as at 30 June 2023.
- Total Non-Current Assets: Rs. 4,144,104 (‘000) as at 30 June 2024, compared to Rs. 4,311,750 (‘000) as at 30 June 2023.
- Property, Plant & Equipment: Rs. 3,375,242 (‘000) as at 30 June 2024, compared to Rs. 3,543,240 (‘000) as at 30 June 2023.
- Intangible Assets: Rs. 9,630 (‘000) as at 30 June 2024, compared to Rs. 2,625 (‘000) as at 30 June 2023.
- Right of Use Assets: Rs. 735,396 (‘000) as at 30 June 2024, compared to Rs. 748,587 (‘000) as at 30 June 2023.
- Total Current Assets: Rs. 799,257 (‘000) as at 30 June 2024, compared to Rs. 742,748 (‘000) as at 30 June 2023.
- Inventories: Rs. 97,781 (‘000) as at 30 June 2024, compared to Rs. 85,548 (‘000) as at 30 June 2023.
- Trade and Other Receivables: Rs. 294,641 (‘000) as at 30 June 2024, compared to Rs. 281,432 (‘000) as at 30 June 2023.
- Cash & Cash Equivalents: Rs. 209,013 (‘000) as at 30 June 2024, compared to Rs. 175,879 (‘000) as at 30 June 2023.
Equity and Liabilities
- Total Equity: Rs. (1,644,749) (‘000) as at 30 June 2024, compared to Rs. (1,431,014) (‘000) as at 30 June 2023.
- Stated Capital: Rs. 1,396,375 (‘000) as at 30 June 2024 and 30 June 2023.
- Retained Earnings: Rs. (4,277,264) (‘000) as at 30 June 2024, compared to Rs. (4,196,975) (‘000) as at 30 June 2023.
- Total Liabilities: Rs. 6,588,110 (‘000) as at 30 June 2024, compared to Rs. 6,485,512 (‘000) as at 30 June 2023.
- Non-Current Liabilities: Rs. 4,516,570 (‘000) as at 30 June 2024, compared to Rs. 4,995,776 (‘000) as at 30 June 2023.
- Current Liabilities: Rs. 2,071,539 (‘000) as at 30 June 2024, compared to Rs. 1,489,735 (‘000) as at 30 June 2023.
Analysis
TAL Lanka PLC experienced a challenging period with a significant decline in net profit and increased finance costs. The company’s revenue decreased slightly, while the cost of sales saw a modest reduction. Administrative expenses increased, contributing to the overall loss. The significant increase in finance costs further impacted the financial results negatively. Despite these challenges, the company maintained stable total assets and saw a slight improvement in gross profit.