Profitability:
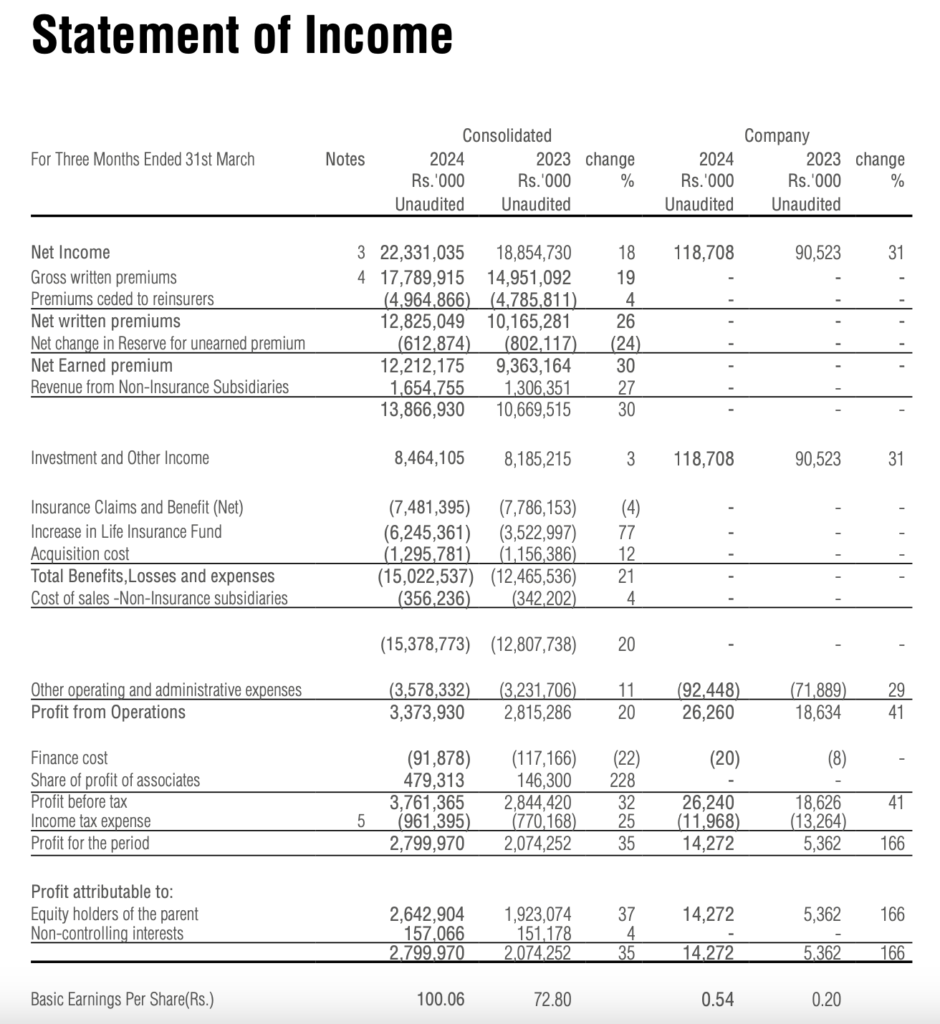
Ceylinco Insurance PLC reported a consolidated profit of Rs 2,799,970,000 for the quarter ended 31st March 2024. This is an increase from the profit of Rs 2,074,252,000 reported for the same period in the previous year. This indicate an improvement in profitability year-over-year.
Revenue Streams:
The company’s revenue streams include premiums/revenue received from customers, which amounted to 17,636,377,000 Sri Lankan Rupees (Rs.’000) for the quarter. This is an increase from the 14,594,882,000 Sri Lankan Rupees (Rs.’000) reported in the same period of the previous year, indicating growth in the company’s core insurance business.
Expenses:
The interim financial statements do not provide detailed expense data for the quarter ended 31st March 2024. However, the increase in profitability suggests that the company has managed its expenses effectively or has experienced growth in revenue that outpaces the growth in expenses.
Segment Performance:
The company operates in various segments, including non-life insurance, life insurance, healthcare, power generation, foreign operations, male education, and other operations. The profitability of these segments contributes to the overall profitability of the company. The specific performance of each segment is not detailed in the context provided, but the consolidated profit indicates that the segments collectively performed well.
Earnings Per Share (EPS):
The basic earnings per share (EPS) for the group was 100.06 Sri Lankan Rupees for the quarter ended 31st March 2024, which is an increase from the EPS of 72.80 Sri Lankan Rupees for the same period in the previous year. This indicates that the earnings attributable to each share of the company have increased, which is a positive sign for investors.
Ceylinco Insurance PLC has shown an increase in profitability and revenue for the quarter ended 31st March 2024 compared to the same period in the previous year. The company’s financial performance appears to be strong, with growth in core business areas and an increase in earnings per share. However, for a complete analysis, one would need to review the full interim financial statements, including detailed expenses, segment performance, and the statement of financial position as of 31st March 2024.
Key Ratios (FY2023)
Based on the information provided in the context from the Ceylinco Insurance PLC Integrated Annual Report for the year ended 31 December 2023, the following key financial ratios can be identified:
- Return on Equity (ROE): The Return on Equity for Ceylinco Insurance PLC was 13.6% in 2023, which is a decrease from 16.2% in 2022. This ratio measures the company’s profitability relative to shareholders’ equity.
- Dividend Cover: The Dividend Cover was 9 times in 2023, compared to 11 times in 2022. This indicates how many times the company can pay dividends to its shareholders out of its net profit.
- Price Earning (P/E) Ratio – Voting: The P/E ratio for voting shares was 6.0 times in 2023, down from 4.7 times in 2022. This ratio indicates the market’s valuation of the company’s earnings for voting shares.
- Price Earning (P/E) Ratio – Non-Voting: The P/E ratio for non-voting shares was 2.0 times in 2023, slightly down from 2.1 times in 2022. This ratio indicates the market’s valuation of the company’s earnings for non-voting shares.
- Net Loss Ratio (Non-Life Insurance): The Net Loss Ratio for the non-life insurance segment was 57% in 2023, which is an improvement from 53% in 2022. This ratio measures the percentage of claims paid out compared to the net earned premiums.
- Net Expense Ratio (Non-Life Insurance): The Net Expense Ratio for the non-life insurance segment was 44% in 2023, which is a decrease from 46% in 2022. This ratio measures the company’s operational efficiency by comparing underwriting expenses to net earned premiums.
- Net Combined Ratio (Non-Life Insurance): The Net Combined Ratio for the non-life insurance segment was 100% in 2023, which is consistent with 100% in 2022. This ratio is the sum of the net loss ratio and net expense ratio, indicating the profitability of the insurance operations before investment income.
These ratios provide insights into the company’s financial health, profitability, efficiency, and market valuation. It is important to analyze these ratios in the context of the company’s overall performance, industry benchmarks, and economic conditions to make informed assessments about Ceylinco Insurance PLC’s financial stability and future prospects.
Strengths and Weakneses
Based on the provided context from the “Ceylinco Insurance PLC – Annual-Dec 2023.pdf,” here are some strengths and weaknesses of Ceylinco Insurance PLC compared to other insurance companies:
Strengths:
- Market Leadership: Ceylinco Insurance PLC, through its subsidiaries Ceylinco Life Insurance and Ceylinco General Insurance, enjoys market leadership in their respective sub-sectors, being the highest-grossing insurance firms in the nation.
- Brand Recognition: The company has commendable brand recognition, with Ceylinco Life being honored as the ‘Most Popular Life Insurance Brand of the Year’ for 17 consecutive years.
- Financial Performance: The company has shown a notable financial achievement with a 14.6% increase in premium income and a significant market share of 21.85% in 2023 for its life insurance division.
- Asset Base: Ceylinco General Insurance retains the top-most asset base within the general insurance sector, indicating strong financial stability.
- Innovation: Both subsidiaries have been recognized for their innovative approaches, with Ceylinco General Insurance introducing industry-first solutions and services.
- Awards and Recognition: The company has received accolades for excellence in financial reporting, including awards from the South Asian Federation of Accountants and the Institute of Chartered Accountants of Sri Lanka.
Weaknesses:
- Economic Sensitivity: The general insurance industry, including Ceylinco, grappled with the ban on vehicle imports, which caused a substantial strain on business growth in motor insurance.
- Profitability Pressure: There was a slight decline in return on equity and a reduction in earnings per share (EPS) by the end of 2023, indicating some pressure on profitability.
- Regulatory Challenges: The company must maintain constant vigilance on regulatory changes and economic developments that impact company financials and growth expectations.
- Increased Expenses: Selling expenses increased as the company undertook numerous initiatives to boost brand recognition, which could impact profit margins if not managed effectively.
- Dependence on Core Markets: While having a strong position in the Sri Lankan market is a strength, it can also be a weakness if the company is not diversified enough geographically to mitigate risks associated with the local economy.
It is important to note that this analysis is based on historical data from the annual report of 2023 and does not include any developments or changes that may have occurred after the knowledge cutoff date. For a more current and comprehensive analysis, one would need to review the latest financial statements, market reports, and industry data.