
Based on the provided context from the interim financial statements of PGP Glass Ceylon PLC for the year ended 31st March 2024, the financial performance of the company can be summarized as follows:
Revenue and Profitability:
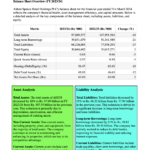
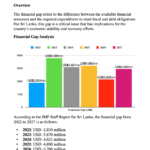
- Revenue for the year ended 31st March 2024 was LKR 17,823,509,000, a decrease from the previous year’s revenue of LKR 20,067,308,000.
- Gross Profit for the year was not directly provided, but the cost of sales was LKR 12,548,397,000, which can be used to calculate the gross profit by subtracting it from the revenue.
- The company reported a profit for the year (retained earnings) of LKR 3,180,300,000.
Share Performance:
- The market price of PGP Glass Ceylon PLC’s ordinary shares saw a highest price of LKR 30.50 and a lowest price of LKR 25.60 during the quarter ended 31st March 2024. The last traded price was LKR 29.80.
- The earnings per share (EPS) for the year ended 31st March 2024 was LKR 3.09, which is a decrease from the previous year’s EPS of LKR 3.35.
Dividends:
- The Board of Directors proposed a first & final dividend of LKR 1.55 per share for the financial year ended 31st March 2024.
Equity and Reserves:
- The company’s stated capital as at 1st April 2022 was LKR 1,526,407,000.
- Total comprehensive income for the year, which includes profit for the year and other comprehensive income, was LKR 3,180,300,000.
- Other comprehensive income showed a deduction of LKR 148,000.
Market Capitalization:
- The float-adjusted market capitalization as at 31st March 2024 was LKR 5,946,175,849.
Public Holding:
- The percentage of public holding as at 31st March 2024 was 21.22%, with the total number of shareholders holding the public portion being 11,127.
Directorate:
- There were changes in the board of directors with Dr. C.T.S.B Perera and R.M.S. Fernando resigning with effect from 25th April 2024.
Key Financial Ratios
Based on the available information, here are some of the key ratios that can be calculated:
- Earnings Per Share (EPS):
- EPS for the year ended 31st March 2024 is LKR 3.09.
- Gross Profit Margin:
- Gross Profit for the year ended 31st March 2024 can be calculated by subtracting the Cost of Sales from Revenue.
- Gross Profit = Revenue – Cost of Sales = LKR 17,823,509,000 – LKR 12,548,397,000 = LKR 5,275,112,000.
- Gross Profit Margin = (Gross Profit / Revenue) x 100 = (LKR 5,275,112,000 / LKR 17,823,509,000) x 100 ≈ 29.59%.
- Net Profit Margin:
- Net Profit Margin requires Net Profit, which is not directly provided. However, if we assume that the “Profit for the year” is the Net Profit after tax and other expenses, we can calculate the margin.
- Net Profit Margin = (Net Profit / Revenue) x 100 = (LKR 3,180,300,000 / LKR 17,823,509,000) x 100 ≈ 17.85%.
- Dividend Per Share (DPS):
- DPS for the year ended 31st March 2024 is LKR 1.55.
- Price to Earnings Ratio (P/E):
- P/E Ratio = Market Price per Share / EPS.
- Using the Last Traded Price of LKR 29.80, P/E Ratio = LKR 29.80 / LKR 3.09 ≈ 9.64.
- Return on Equity (ROE):
- ROE = (Net Income / Shareholder’s Equity) x 100.
- Shareholder’s Equity as at 31st March 2024 is LKR 11,068,392,000 (from the Statement of Changes in Equity).
- Assuming Net Income is the same as “Profit for the year,” ROE = (LKR 3,180,300,000 / LKR 11,068,392,000) x 100 ≈ 28.73%.
Please note that these calculations are based on the assumption that the “Profit for the year” figure represents the net income, and the actual net income may differ if there are other factors not accounted for in the provided context. Additionally, other ratios like Return on Assets (ROA), Debt to Equity Ratio, Current Ratio, etc., cannot be calculated without additional information such as total assets and liabilities.
This Analysis was compiled by LankaBIZ (AI Assistant) based on publicly available information. Click below link to Chat with LankaBIZ AI to find answers to queries relating Sri Lanka economy, Business regulations, Corporate Analysis & Stock Market Research.
www.lankabizz.net