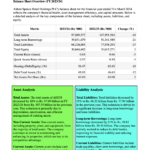

The financial performance of HNB Assurance PLC as at 31st March 2024 is as follows:
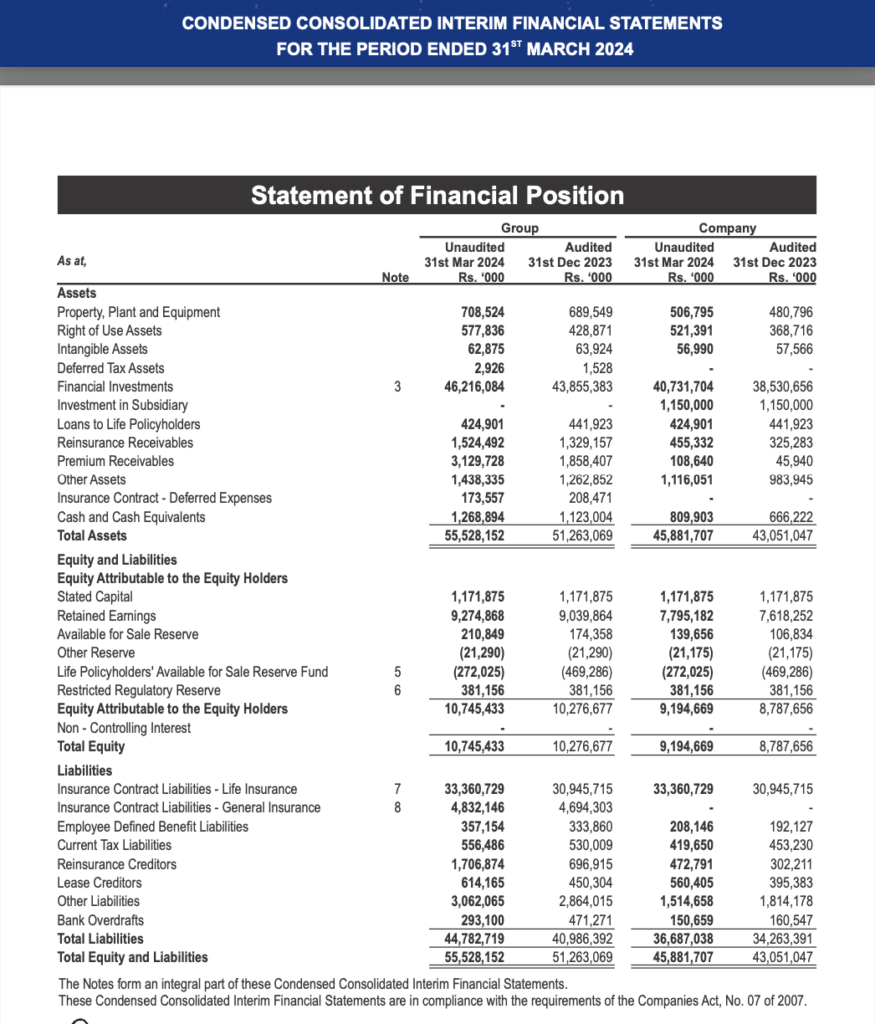
- Investment Balance: The company’s investment balance, which includes deposits and debentures, stood at LKR 3,103,026,000 as of 31st March 2024, compared to LKR 3,017,870,000 as of 31st December 2023. For the group, the investment balance was LKR 2,738,453,000 as of 31st March 2024, up from LKR 2,636,221,000 as of 31st December 2023.
- Cash at Bank Balances: The company’s cash at bank balances increased to LKR 943,841,000 as of 31st March 2024, from LKR 625,665,000 as of 31st December 2023. The group’s cash at bank balances also increased to LKR 638,073,000 from LKR 503,848,000 in the same period.
- Premium Receivable: The company had premium receivables of LKR 178,619,000 as of 31st March 2024.
- Administration Expenses: The company incurred administration expenses of LKR 8,602,000 for the three months ended 31st March 2024, compared to LKR 10,245,000 for the same period in 2023. For the group, administration expenses were LKR 2,540,000 for the three months ended 31st March 2024, compared to LKR 4,273,000 for the same period in 2023.
- Profit for the Period: The company’s profit for the period was LKR 1,315,000,000, and the group’s profit for the period was LKR 235,004,000 as of 31st March 2024.
- Net Asset Value Per Share: The net asset value per share without restricted regulatory reserve for the company was LKR 58.76 as of 31st March 2024, compared to LKR 56.04 as of 31st December 2023.
- Share Performance: The highest price per share was LKR 60.00, and the lowest was LKR 42.50 for the three months ended 31st March 2024. The last traded price per share was LKR 49.90.
These figures indicate that HNB Assurance PLC has shown a positive financial performance in the first quarter of 2024, with increases in investment balances, cash at bank balances, and profit for the period. The administration expenses have decreased, which could indicate improved operational efficiency. The net asset value per share has also increased, which is a positive sign for shareholders.
Key Financial Ratios
- Capital Adequacy Ratio (CAR): For HNB Assurance PLC (HNBA), the CAR as of the end of December 2023 was 341%. This is a measure of the company’s capital and is used to protect policyholders and promote the stability and efficiency of financial systems around the world.
- Claims Ratio (without policy maturities): As of 2023, the claims ratio was 12%. This ratio is a measure of the claims paid out compared to the premiums earned and is an indicator of the underwriting performance of an insurance company.
- Expense Ratio: The expense ratio for HNB Assurance PLC in 2023 was 53%. This ratio measures the company’s operational efficiency by comparing the operating expenses to the net premiums earned.
- Combined Ratio: The combined ratio for the company in 2023 was 79%. This is a measure of profitability used by an insurance company to gauge how well it is performing in its daily operations. A ratio below 100% indicates that the company is making an underwriting profit, while a ratio above 100% means it is paying out more money in claims that it is receiving from premiums.
Please note that these ratios are based on the data from the year 2023.
This Analysis was compiled by LankaBIZ (AI Assistant) based on publicly available information. Click below link to Chat with LankaBIZ AI to find answers to queries relating Sri Lanka economy, Business regulations, Corporate Analysis & Stock Market Research.
www.lankabizz.net