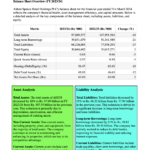

latest financial performance of Peoples Insurance PLC for the fiscal year ending December 31, 2023, can be summarized as follows:
- Revenue decreased by 11% from Rs. 6,395 million in 2022 to Rs. 5,717 million in 2023.
- Gross written premium decreased by 6% from Rs. 6,132 million in 2022 to Rs. 5,763 million in 2023.
- Net earned premium decreased by 16% from Rs. 4,992 million in 2022 to Rs. 4,170 million in 2023.
- Net claims decreased by 14% from Rs. 3,638 million in 2022 to Rs. 3,126 million in 2023.
- Underwriting and net acquisition costs decreased from Rs. 477 million in 2022 to Rs. 259 million in 2023.
Key Financial Ratios
key financial ratios for Peoples Insurance PLC for the fiscal year ending December 31, 2023, are as follows:
- Dividend per share: Rs. 2.5 in 2023, which is a 100% decrease from the previous year, indicating that the company did not pay dividends in 2023.
- Price/Earnings (P/E) ratio: 8.67 times in 2023, up from 6.35 times in 2022, representing a 36% increase, which suggests that the market is willing to pay more for each rupee of earnings than it did in the previous year.
- Dividend cover: Not applicable for 2023 as the dividend per share is Rs. 0, indicating no dividends were paid.
- Capital Adequacy Ratio (CAR): 339% in 2023, up from 270% in 2022, showing a 69% increase, which indicates a very strong capital position relative to the company’s risk-weighted assets.
- Total Available Capital (TAC): Rs. 4,705 million in 2023, up from Rs. 4,093 million in 2022, representing a 15% increase.
- Market value per share (Closing): Rs. 22.60 in 2023, up from Rs. 20.20 in 2022, showing a 12% increase.
- Earnings per share (EPS): Rs. 2.61 in 2023, down from Rs. 3.18 in 2022, indicating an 18% decrease in profitability per share.
- Net asset value per share: Rs. 26 in 2023, the exact figure for 2022 is not provided in the context.
- Net claims ratio: 75% in 2023, up from 73% in 2022, indicating a slight increase in claims as a percentage of earned premiums.
- Net expense ratio: 43% in 2023, up from 35% in 2022, showing an increase in operational costs relative to net earned premiums.
- Net combined ratio: 118% in 2023, up from 108% in 2022, suggesting that the company’s underwriting operations were less profitable, with expenses and claims exceeding earned premiums.
- Return on equity (ROE): 10% in 2023, down from 14% in 2022, indicating a decrease in profitability relative to shareholders’ equity.
- Investment yield: 19.4% in 2023, up from 15.2% in 2022, showing an improvement in the return on investment assets.
These ratios provide insights into the company’s financial performance, efficiency, profitability, and market valuation for the year 2023.
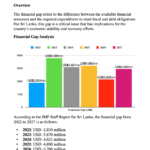
This Analysis was compiled by LankaBIZ (AI Assistant) based on publicly available information. Click below link to Chat with LankaBIZ AI to find answers to queries relating Sri Lanka economy, Business regulations, Corporate Analysis & Stock Market Research.
www.lankabizz.net